Display Area
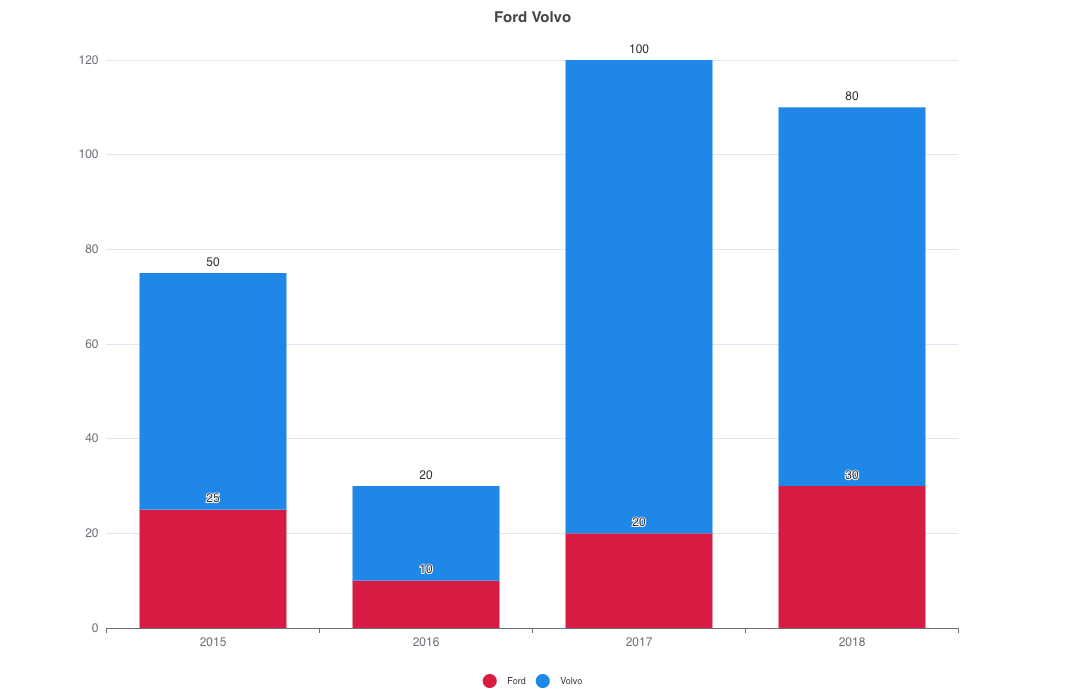
The exhibition area mainly refers to the display area of the final effect of the chart. All the user's designs will be displayed immediately in the chart display area to achieve a real-time preview effect
Precondition
After registering and logging in ChartCool, enter the online drawing tool designer
Function overview
Interface Effects
Function overview
1. The display area will present the structure designed by the user in real time. If there is an abnormal situation, the interface may be blank or a prompt of the data format will appear. 2. The data source will show in real time where the data of the current chart comes from
"Data source: template data" Indicates that the data of the current chart comes from the sample data of the selected template "Data source: custom data" Indicates that the data of the current chart comes from the data configured by the user or the data after modifying the force data