Tasarımcı Tanıtımı
ChartCool'a giriş yaptıktan sonra kullanıcılar, ChartCool çevrimiçi çizim tasarımcısı aracılığıyla tüm grafiklerin tasarımını ve üretimini tamamlayabilir. Bu tasarımcı, ChartCool platformunun temel modülüdür ve birçok başka modül de vardır.
Ön Koşul
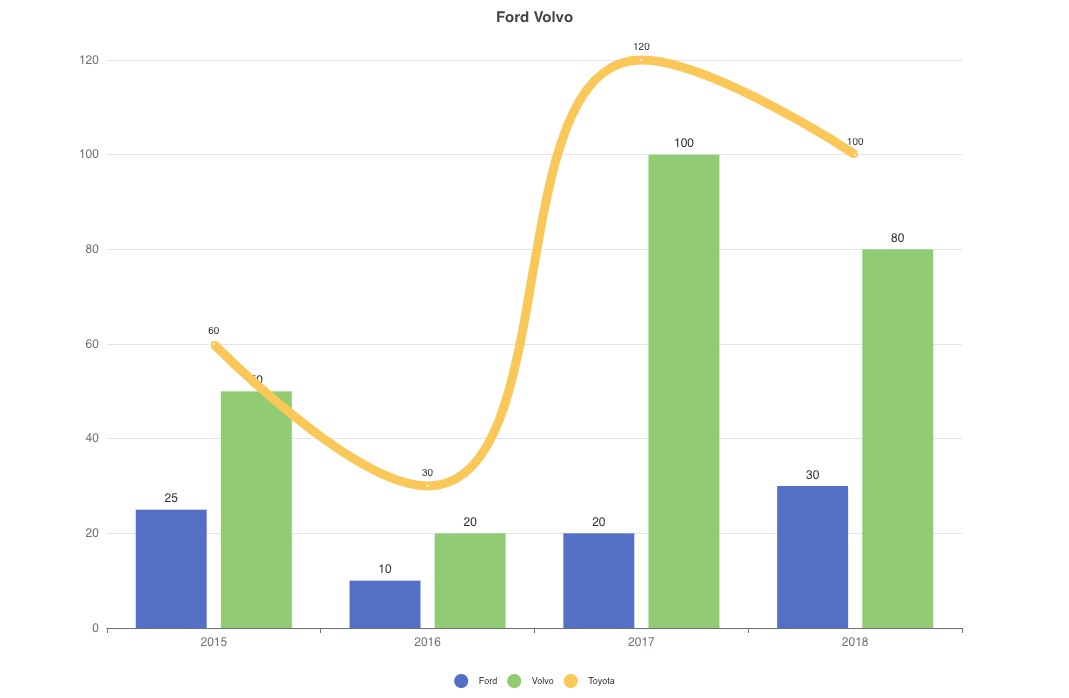
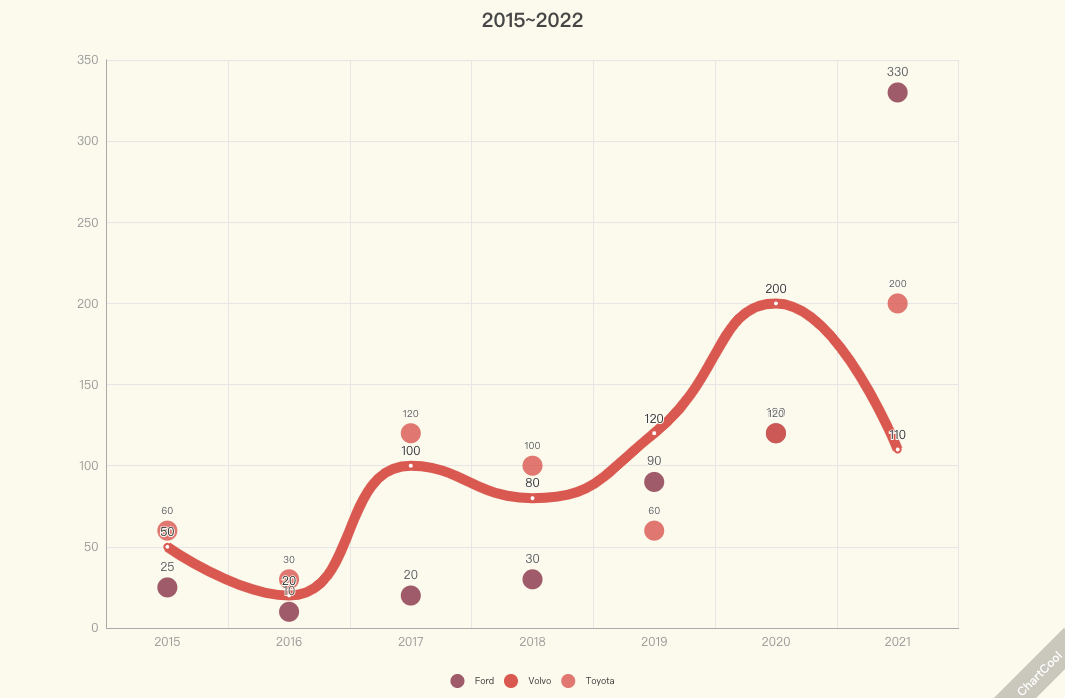
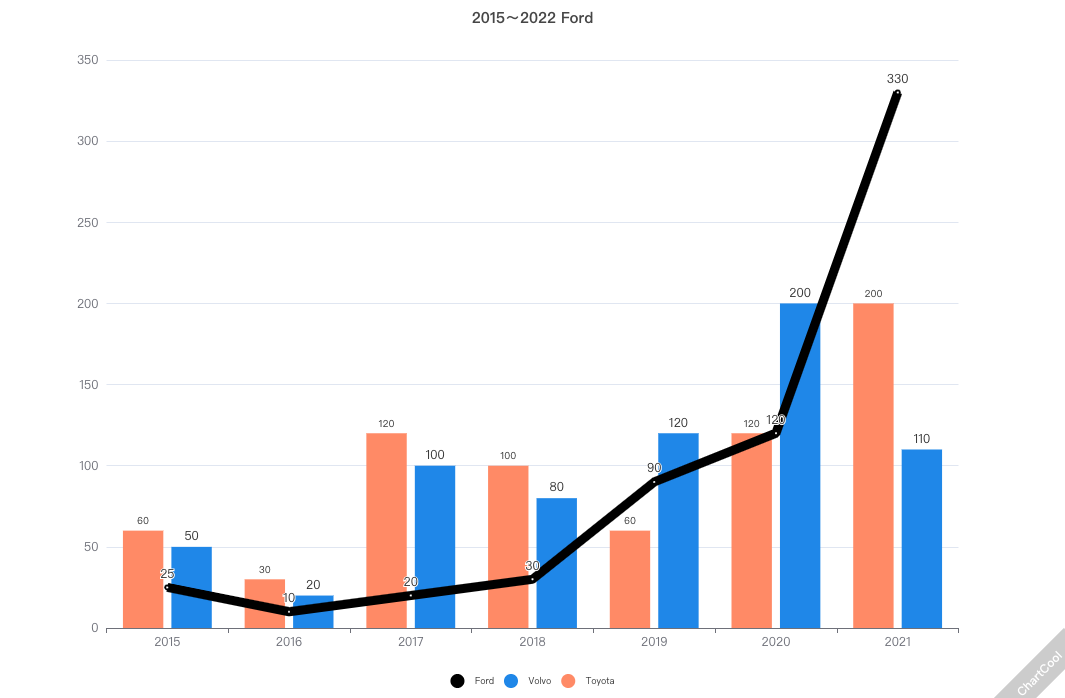
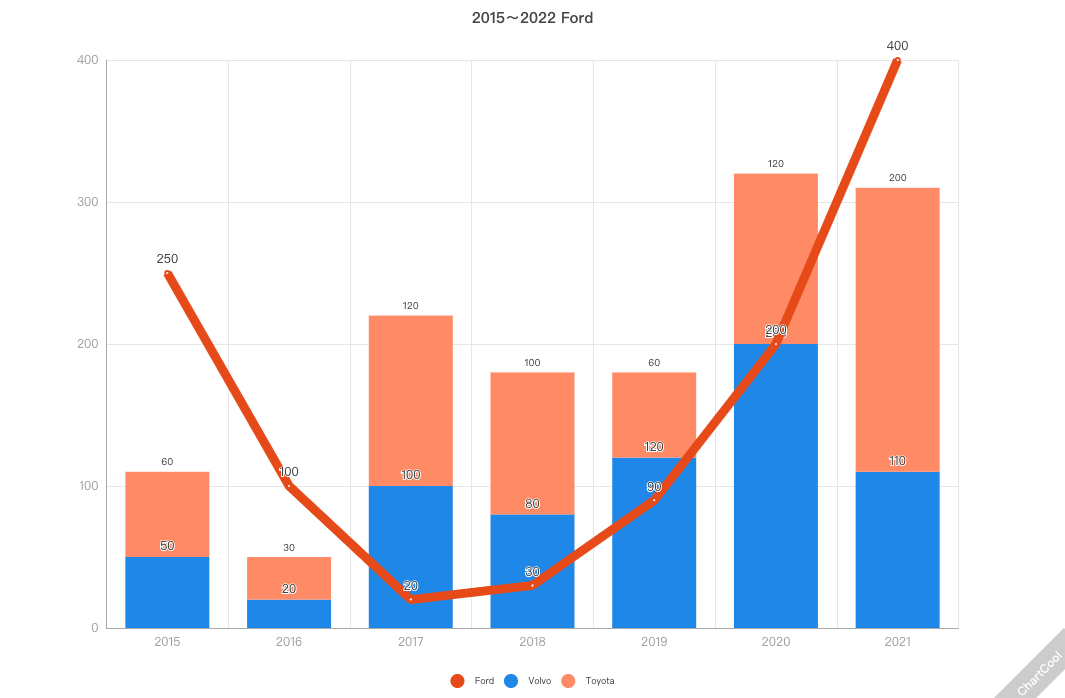
ChartCool'a kaydolduktan ve giriş yaptıktan sonra çevrimiçi çizim aracı tasarımcısına girin ve "Veri Yapılandırması"nı açın
Yapı açıklaması (yukarıdan aşağıya)
Üst Gezinme
The top navigation consists of left and right parts, the left side is the editing of the chart name, and the right side is mainly the following commonly used buttons (upgrade member, download chart, share, user homepage, feedback, etc.)
Şablon Seçici
Display the templates prepared by the system for users. Each chart type has a lot of templates for you to choose from. You can choose a category and click on the template to use it (the template will use the user-configured data first. If the user-configured data causes If the template display is abnormal, you can click "Use Template Data" in "Data Configuration" to restore the template effect)
Araç Çubuğu
The toolbar mainly provides some common functions (theme, background, coordinate type, X coordinate, Y coordinate, title, legend, etc.) of the chart integrity of user operations, which will be explained in detail in the toolbar later
Görüntüleme Alanı
The exhibition area mainly refers to the display area of the final effect of the chart. All the user's designs will be displayed immediately in the chart display area to save the display effect
Grafik Yapılandırması
The chart configuration area includes two types (data configuration and general). The data configuration is unified. Conventions have some differences in different types of charts. You can refer to the corresponding type of chart configuration instructions