Combination diagramLineColumnarCake shapeScatterMapradarThermodynamic diagramRectangular treeRising sun chartParallelSankey FunnelWord Cloud Diagram
Statistical map combined with column chart
useCombining the statistical map with the column chart, you can see both the map distribution and the specific data. It is suitable for the data situation display scene of the map's geographical distribution
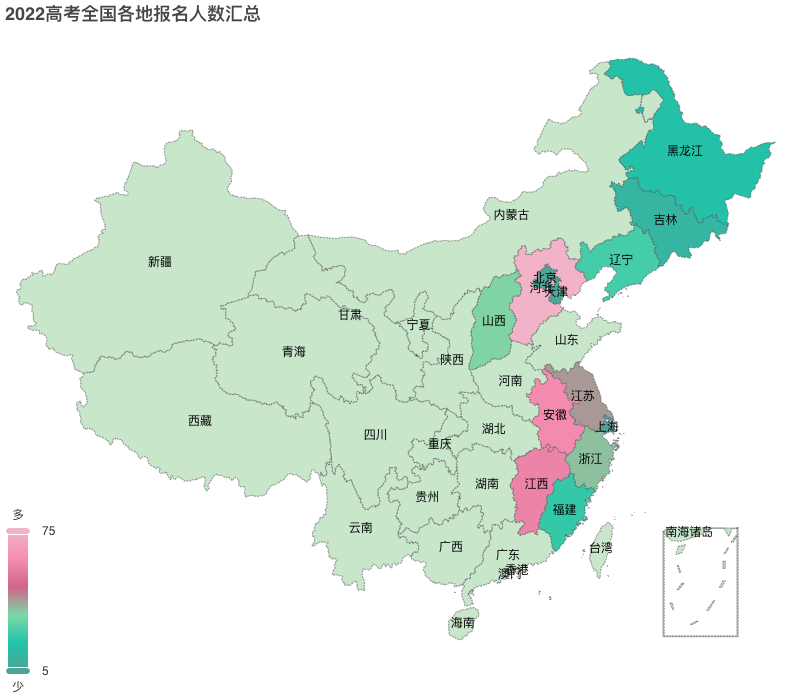
Statistical map of the number of people taking the college entrance examination in some regions in 2022
Statistical map, color area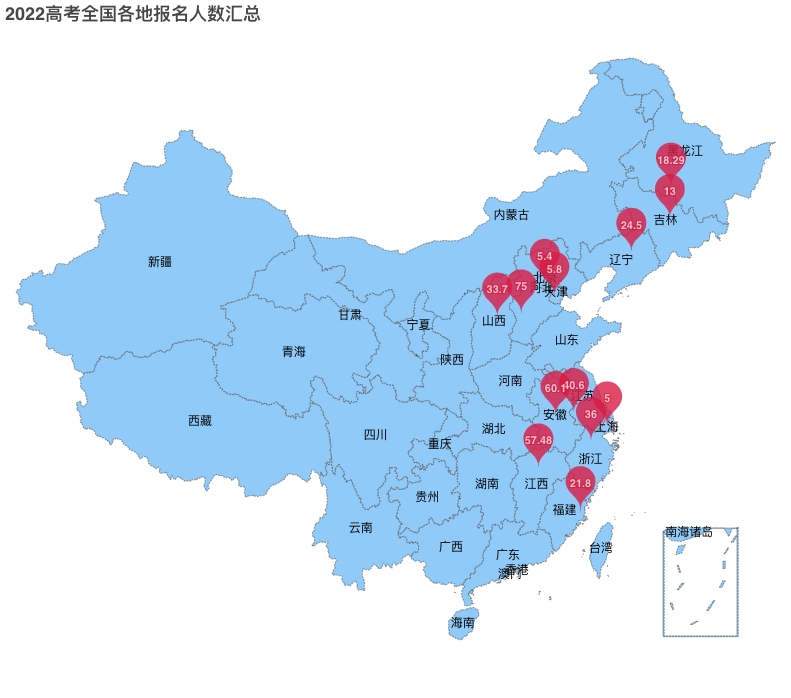
Marked statistical map of the number of people taking the college entrance examination in some regions in 2022
Statistical maps, text labels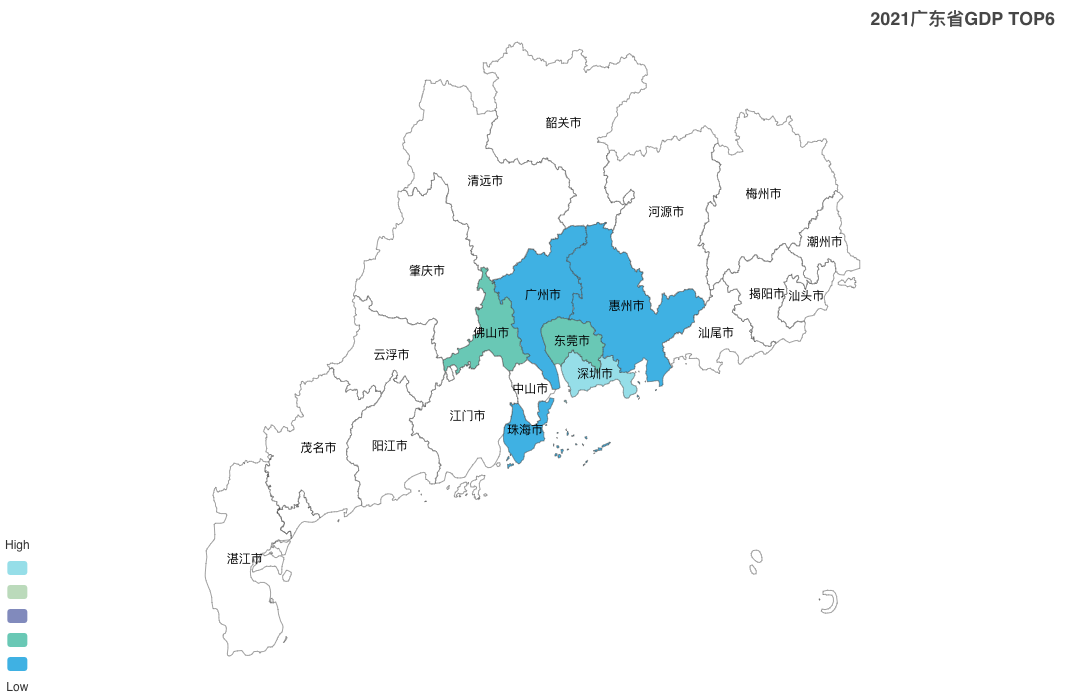
Statistical Map of Top 6 Cities in Guangdong Province in 2021
2021广东省GDP TOP6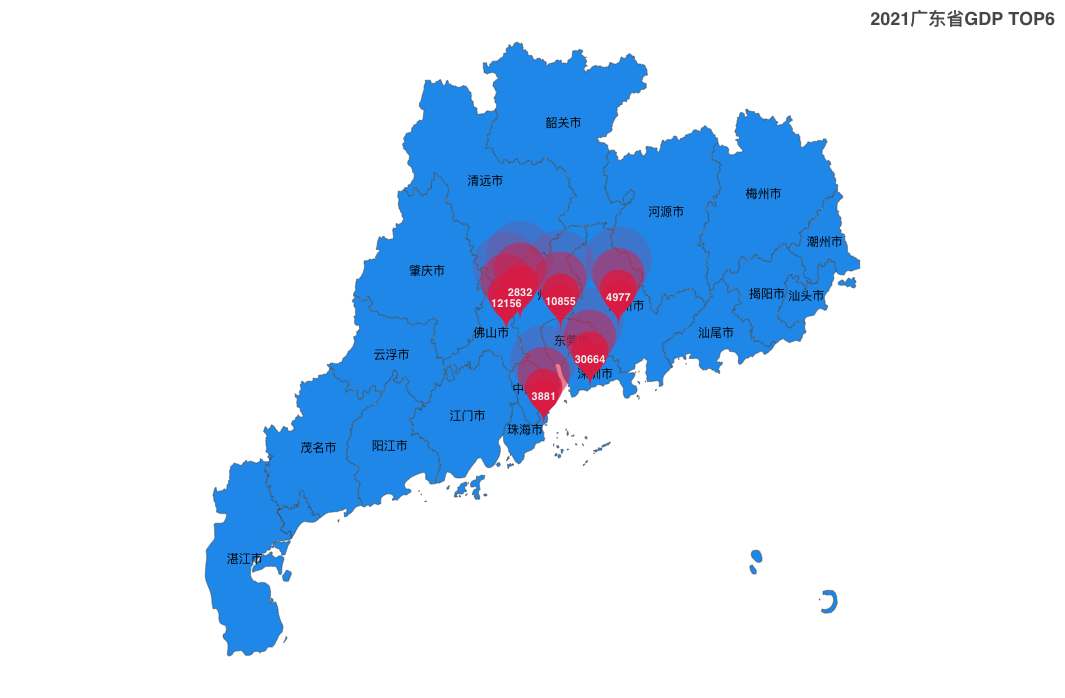
Marked Statistical Map of Top 6 Cities in Guangdong Province in 2021
Statistical maps, dynamic labels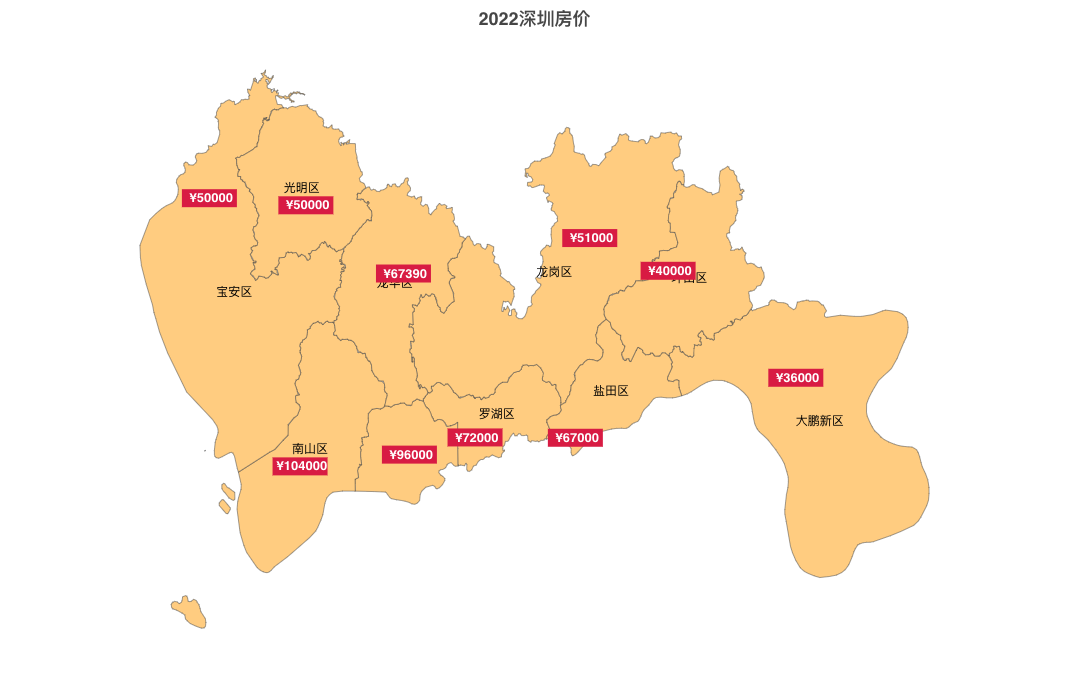
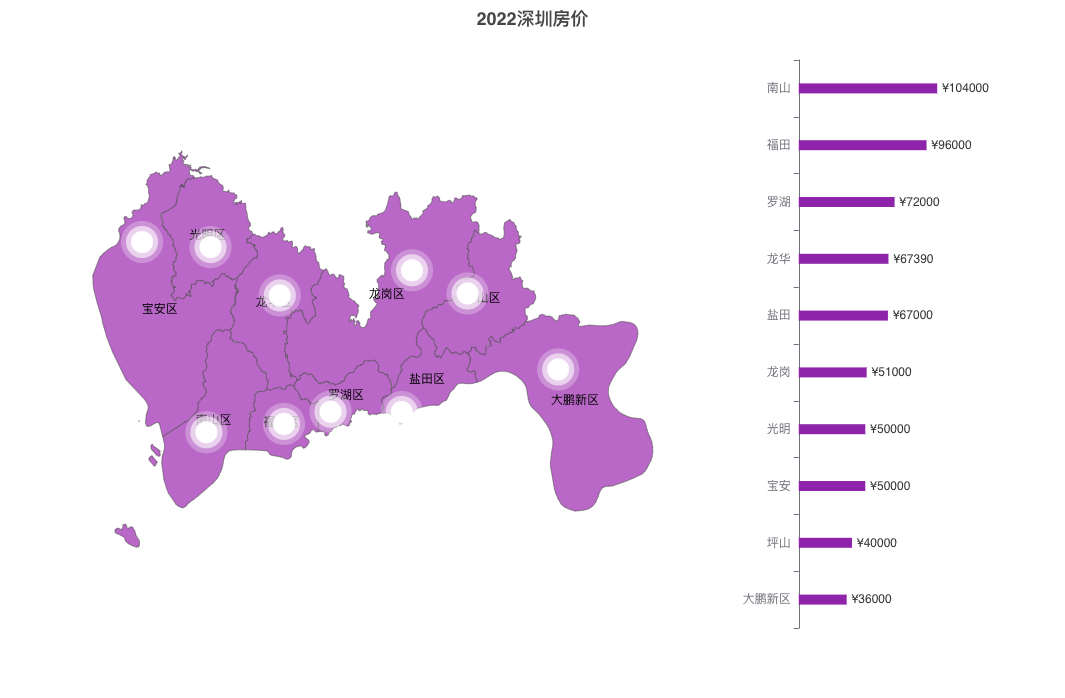
Statistics Map of Housing Prices in Shenenen in 2022
Statistical maps, color labels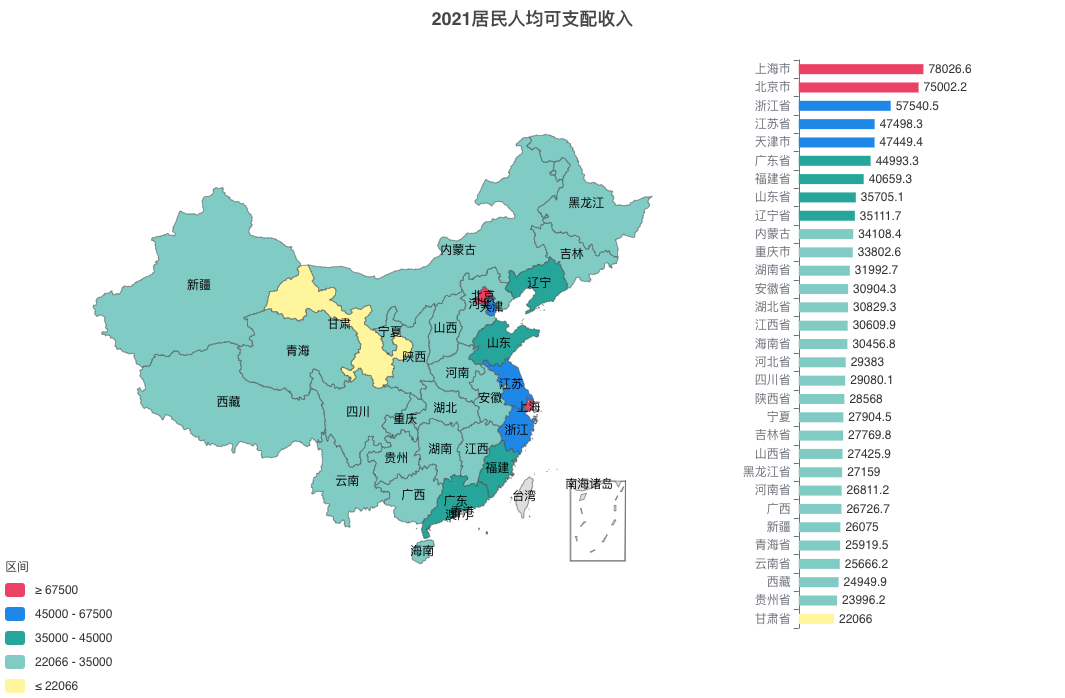
Statistical map combined with column chart
Statistical map, column chart