Isı Haritası
A heat map is a statistical chart that displays data by coloring color blocks. When drawing, you need to specify the rules for color mapping. For example, larger values are represented by darker colors, and smaller values are represented by Lighter colors indicate etc
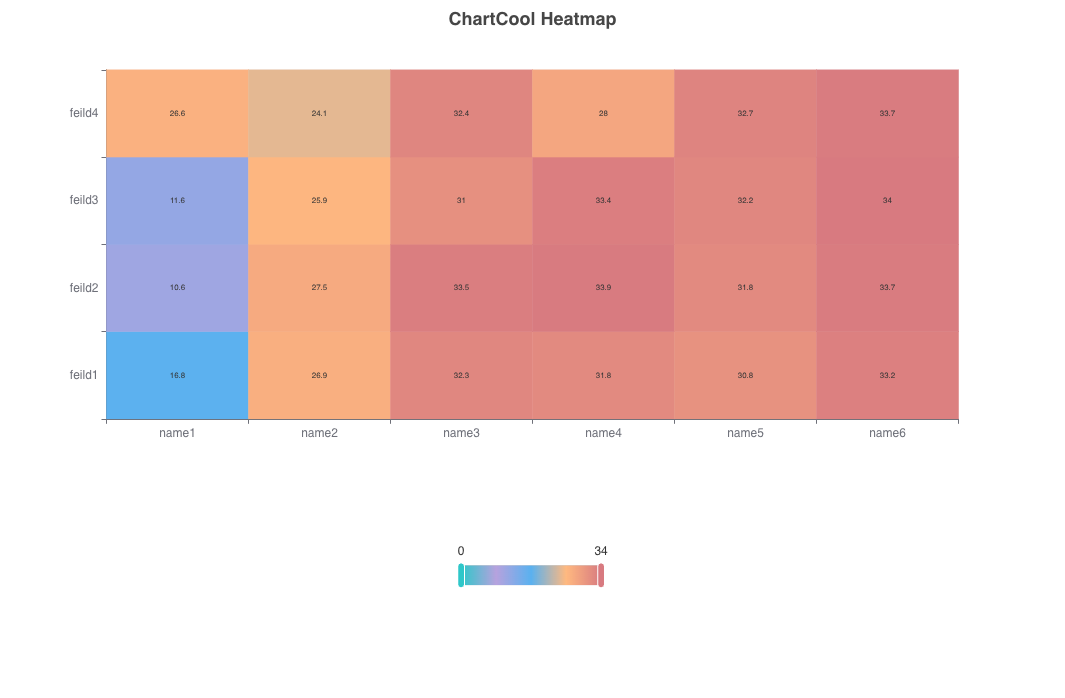
Basic HeatmapGörüntüle
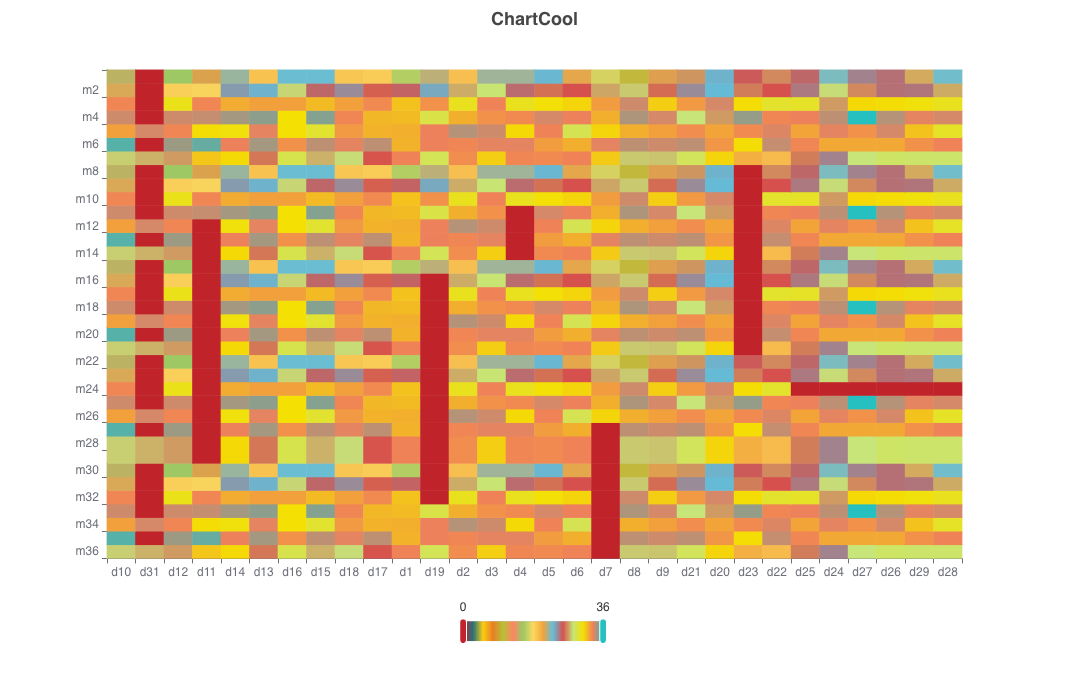
Heatmap with multiple rows and multiple columnsGörüntüle
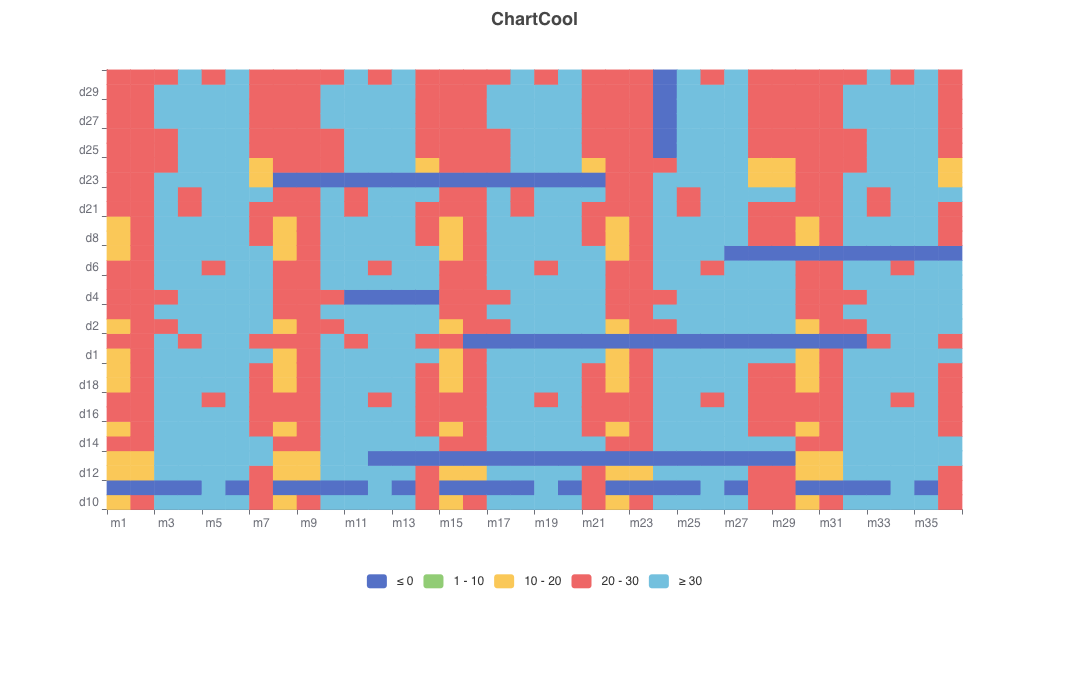
Heatmap of multi-row and multi-column interval colorsGörüntüle
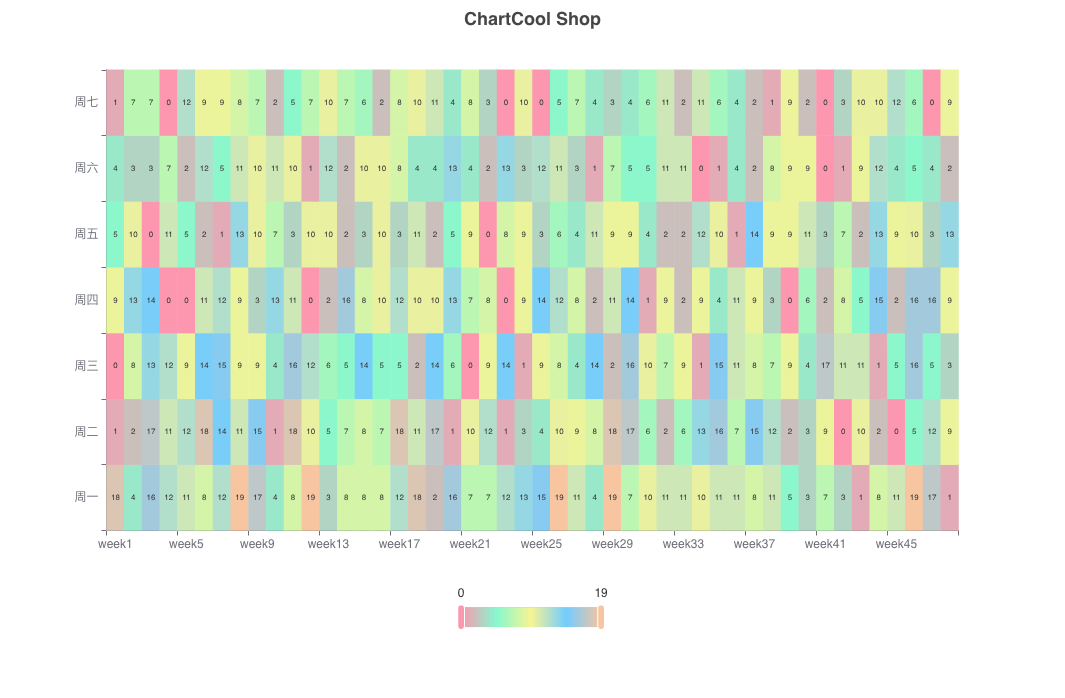
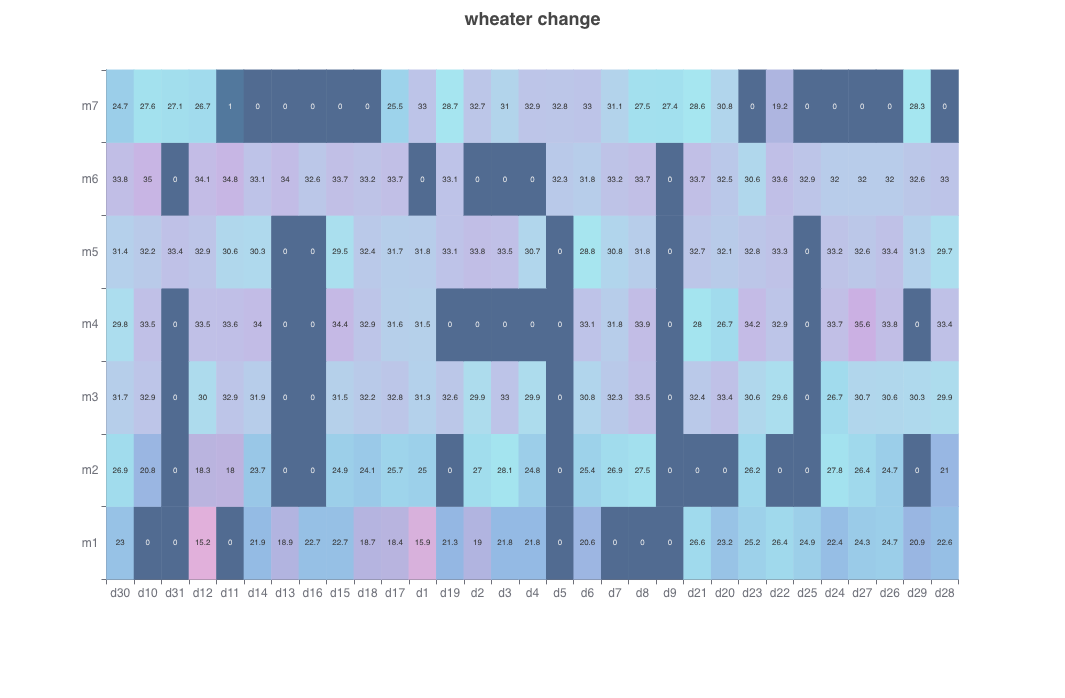
Multi-line and multi-column heatmap for different topicsGörüntüle
Heatmap without helpersGörüntüle
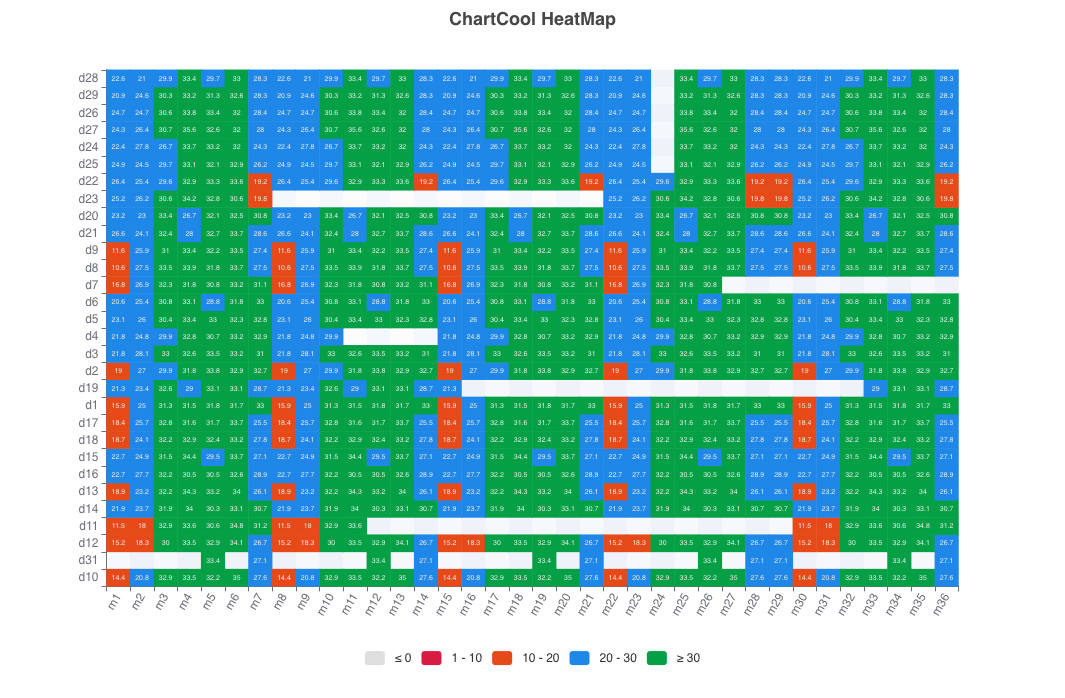
Multi-row and multi-column interval color labelled heatmapGörüntüle